NEPSE Technical Analysis: Critical Support Zone Under Pressure
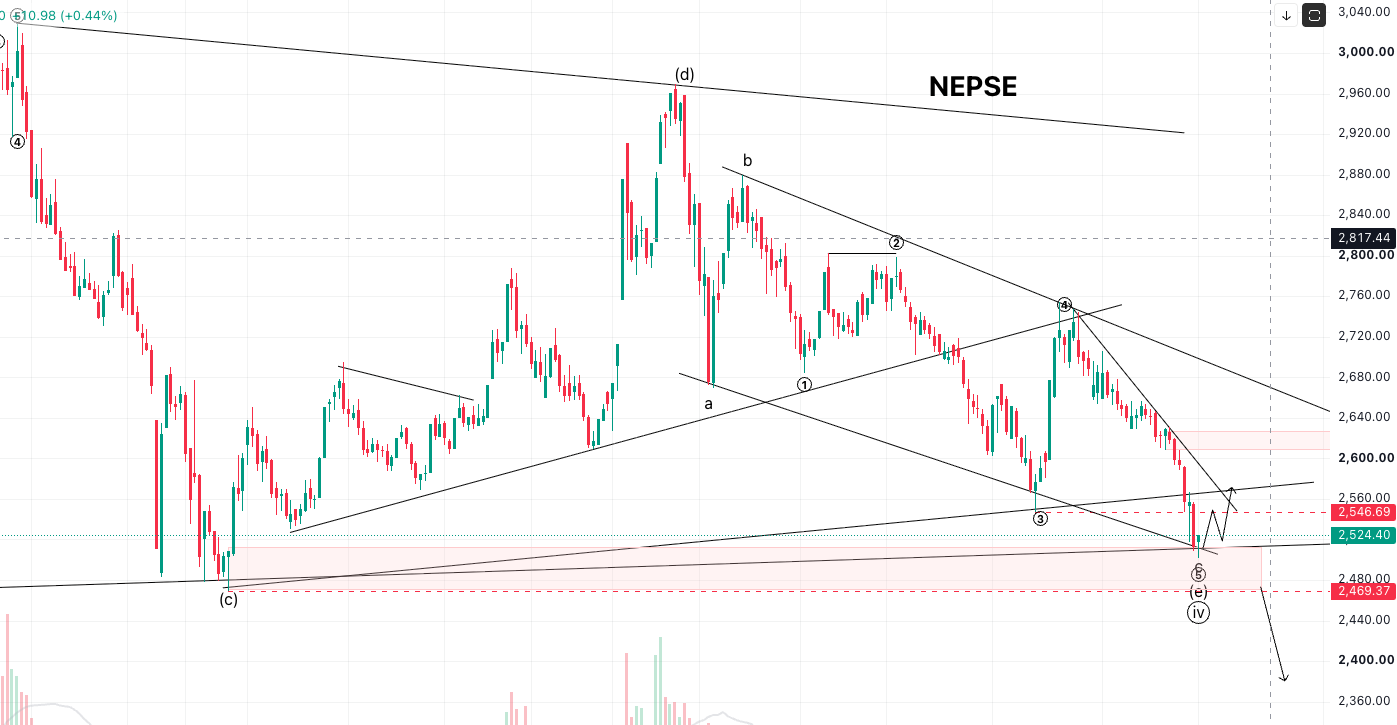
NEPSE is currently trading around the 2,520–2,550 zone, very close to a major technical support area. The chart shows a prolonged corrective structure, with multiple trendlines converging around the 2,480–2,550 region.
From an Elliott Wave perspective, the current price action appears to be approaching the potential completion of a Wave (E) within a larger corrective/triangle structure. However, confirmation is still required before considering the correction complete.
🔻 The Current Structure
The chart appears to show a sequence:
(C) → (D) → (E)
Wave (C): formed around the 2,469 area.
Wave (D): rallied strongly toward approximately 2,969.
Wave (E): is currently developing on the downside.
The current decline has brought NEPSE back toward the important 2,480–2,500 support zone.
This makes the current area particularly important.
🟢 Key Support Zone: 2,480–2,525
The 2,480–2,525 area is the most important zone on the chart.
Several trendlines are converging around this region, making it a potential reaction zone.
If NEPSE holds this area and buyers return, we could see a short-term recovery toward:
2,560 → 2,600–2,630 → 2,700+
A sustained move above 2,600–2,630 would provide stronger evidence that the market is attempting a meaningful recovery.
🔴 What If 2,480 Breaks?
This is where the chart becomes significantly more bearish.
A decisive breakdown below the 2,480–2,470 zone, particularly with strong selling volume, would weaken the bullish Elliott Wave interpretation.
In that scenario, the next downside levels to watch could be:
2,400 → 2,360
The chart itself indicates a potential downside extension toward approximately 2,360 if the major support structure fails.
Therefore, 2,470 is an important invalidation/confirmation area for the current bullish-rebound scenario.
📈 Possible Bullish Scenario
If NEPSE successfully holds the current support and produces a strong reversal candle/impulsive move upward, the first confirmation would come from reclaiming 2,550–2,560.
Above that:
2,600–2,630 becomes the next important resistance zone.
A breakout and sustained close above this area could open the possibility of a move toward 2,700–2,760.
However, traders should avoid assuming that the bottom is confirmed simply because price touches the support zone.
Support is a zone, not a guarantee of reversal.
📉 Bearish Scenario
The alternative scenario is a continuation of the corrective decline.
If NEPSE:
breaks below 2,480–2,470
fails to reclaim the broken support
and selling volume increases,
then the market could potentially extend toward the 2,400–2,360 region.
This would indicate that the current Wave (E) structure invalid
🎯 What Should Traders Watch Now?
Level Importance 2,700–2,760
Major resistance2,630–2,600
Key recovery/resistance zone 2,550–2,560
First bullish confirmation 2,520
Current trading area 2,480–2,470
Major support / critical level 2,400
Next downside support 2,360 Potential bearish target
🧠 Bottom Line
NEPSE is currently at a make-or-break area.
The market is approaching a major support cluster around 2,480–2,525, where the potential completion of the corrective Wave (E) could occur.
If this zone holds and NEPSE reclaims 2,550–2,560, a relief rally toward 2,600–2,630 becomes possible, with higher levels coming into focus if resistance is broken.
On the other hand, a decisive breakdown below 2,470 would invalidate the immediate bullish-reversal setup and increase the probability of a deeper correction toward 2,400 and potentially 2,360.
For now, confirmation is more important than prediction. Rather than trying to call the exact bottom, traders should watch how NEPSE reacts around 2,480–2,525 and wait for price action to confirm the next direction.
Keep reading
 Market analysis
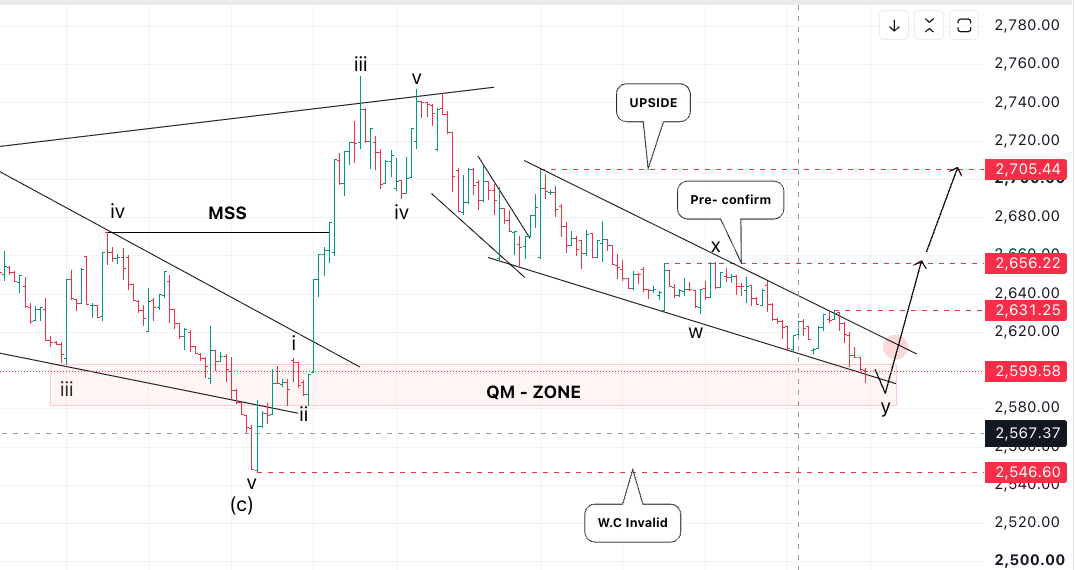
NEPSE 1H Elliott Wave & ICT Analysis: Can the QM Zone Trigger a Reversal?
The NEPSE 1-hour chart is currently sitting at an important technical decision area, with price trading around 2,599.58.From an Elliott Wave perspective, the recent decline appe...
 Market analysis
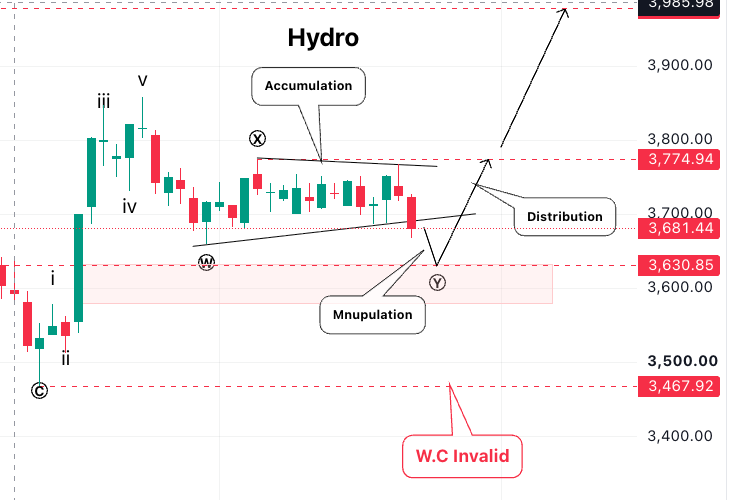
Hydro Index at a Critical Zone: Elliott Wave + ICT Analysis
Elliott Wave:The Hydro index appears to have completed a five-wave advance and is now forming a complex W-X-Y correction. The 3,580–3,630 area is being watched as a potential co...
 Market analysis
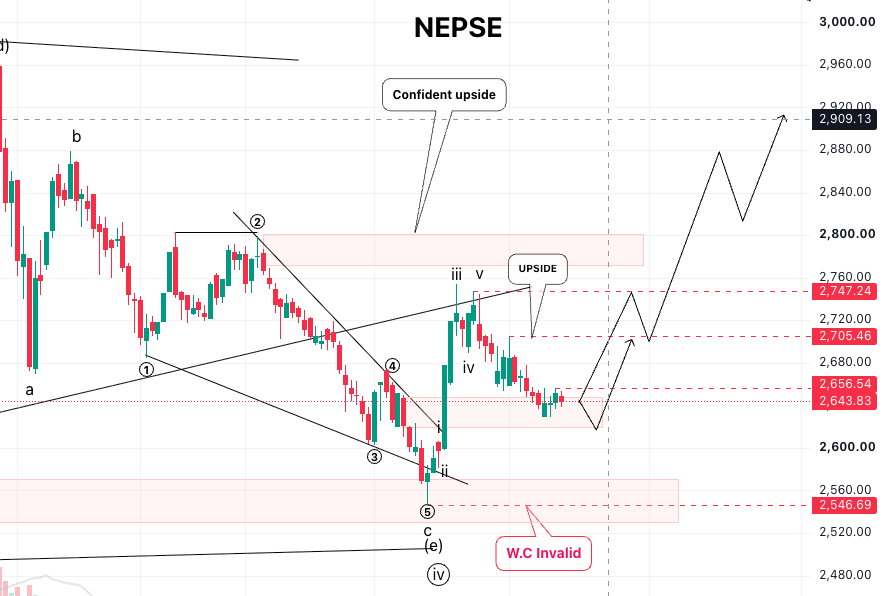
Nepse Technical Analysis
Daily Time FrameNEPSE has currently completed its 4th Minor Wave at 2,546, after which it started the 5th Minor Wave. The 5th wave has now completed its 1st Sub-Wave around 2,75...