NEPSE 1H Elliott Wave & ICT Analysis: Can the QM Zone Trigger a Reversal?
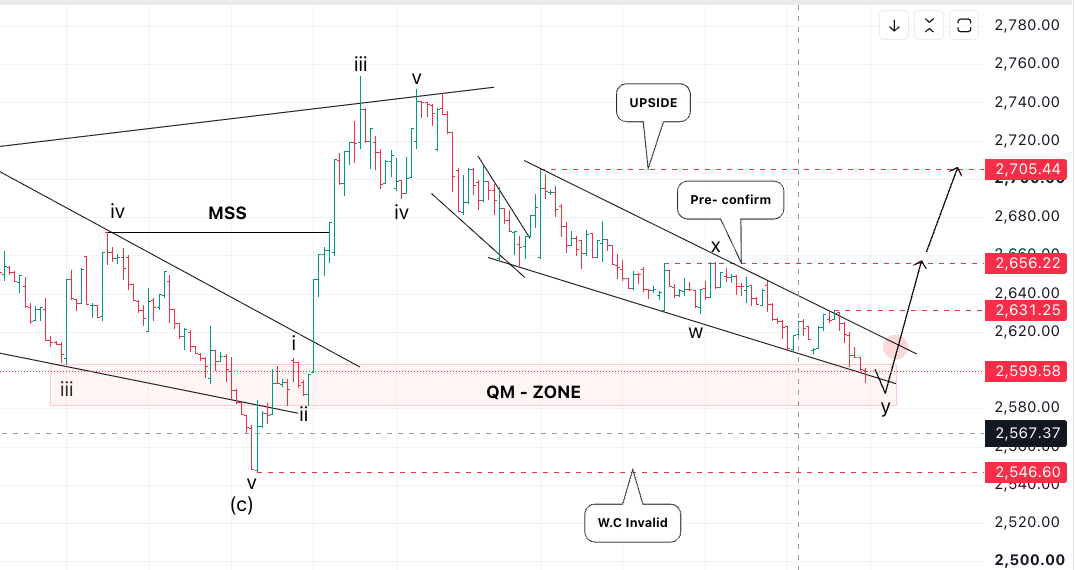
The NEPSE 1-hour chart is currently sitting at an important technical decision area, with price trading around 2,599.58.
From an Elliott Wave perspective, the recent decline appears to be developing as a W-X-Y corrective structure within a descending channel. Price is now approaching the lower portion of the correction and the marked QM (Quasimodo) zone, making the 2580 -2,600 area an important level to watch.
Elliott Wave Structure
The previous advance pushed NEPSE toward the 2,755 area, where the larger upward structure appears to have completed.
Following that high, the market entered a corrective phase. The current structure is labelled as:
W: Initial decline
X: Corrective recovery
Y: Final declining leg
The Y-wave is currently approaching the lower boundary of the corrective structure and the QM zone around 2580 - 2,600.
This creates a potential area where buyers could attempt to regain control.
However, the wave count should not be considered confirmed until price provides stronger structural evidence.
ICT / Market Structure View
From an ICT perspective, the QM zone around 2580 - 2,600 is the key area to monitor.
The first important level on the upside is 2,631.25.
A reclaim of 2,631.25 would provide an initial indication that selling pressure is weakening. However, the more important confirmation comes at 2,656.22.
Key upside levels
2,631.25 — Pre-confirmation
A move above this level would be the first sign of improving short-term structure.
2,656.22 — Major confirmation
A decisive break and hold above this level would strengthen the bullish reversal scenario and potentially signal a breakout from the current corrective channel.
2,705.44 — Upside objective
If NEPSE successfully confirms the breakout above 2,656.22, the next major upside reference shown on the chart is around 2,705.44.
What Could Invalidate the Bullish Scenario?
The bullish interpretation is conditional.
If the QM zone fails to hold and NEPSE continues lower, the corrective structure may extend further.
The first major downside reference is 2,546.60.
A deeper move toward or below 2,528.77 would significantly weaken the current W-X-Y completion thesis and indicate that the expected reversal is not developing as anticipated.
NEPSE 1H Scenario
The current setup can therefore be viewed as a decision zone rather than a confirmed reversal.
Bullish scenario:
Price holds the QM zone → reclaims 2,631.25 → breaks 2,656.22 → potential move toward 2,705.44.
Bearish scenario:
Price fails to hold the QM zone → continues lower → breaks 2,546.60 → deeper weakness toward the 2,528.77 invalidation area.
For now, 2,600–2,656 is the key battlefield. The reaction from the QM zone and the market's ability to reclaim the confirmation levels should determine whether NEPSE is beginning a new bullish leg or simply extending the existing correction.
Technical analysis is scenario-based and not a guarantee of future price movement. Traders should consider risk management and confirmation before taking positions.
Keep reading
 Market analysis
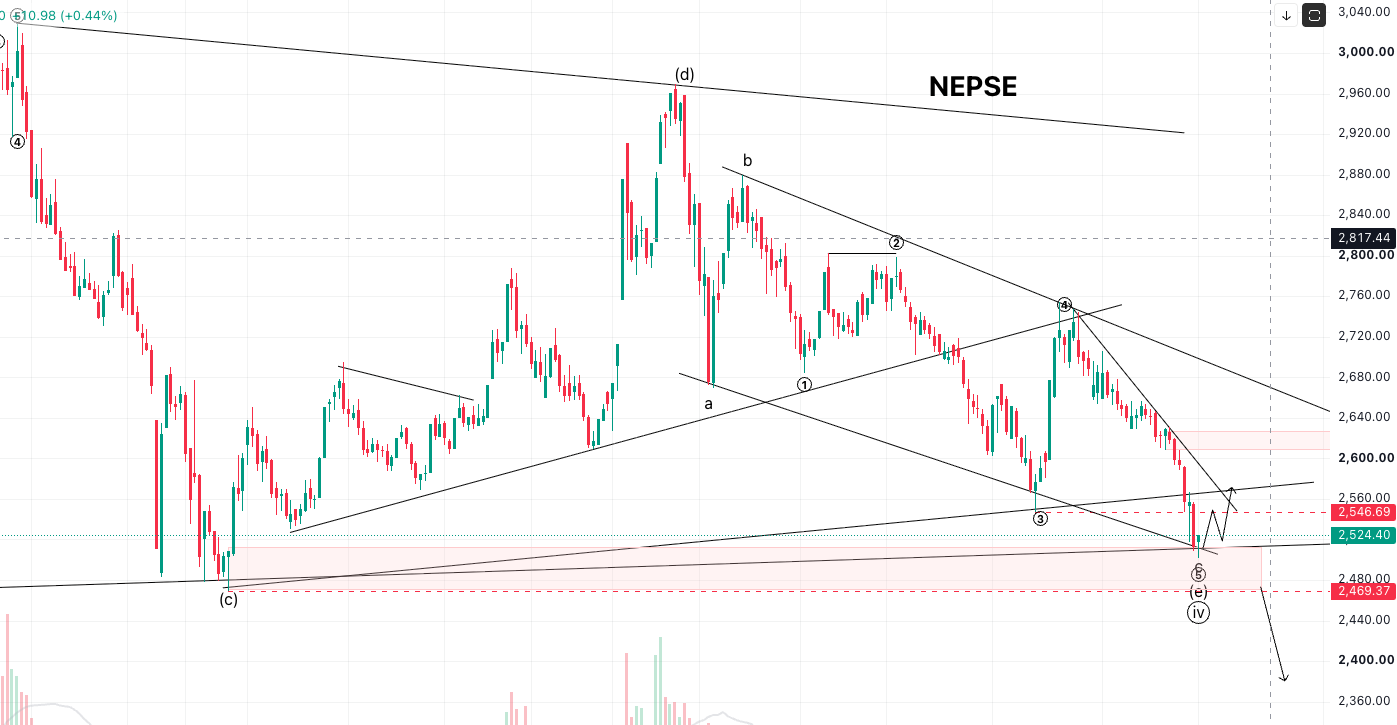
NEPSE Technical Analysis: Critical Support Zone Under Pressure
NEPSE is currently trading around the 2,520–2,550 zone, very close to a major technical support area. The chart shows a prolonged corrective structure, with multiple trendlines ...
 Market analysis
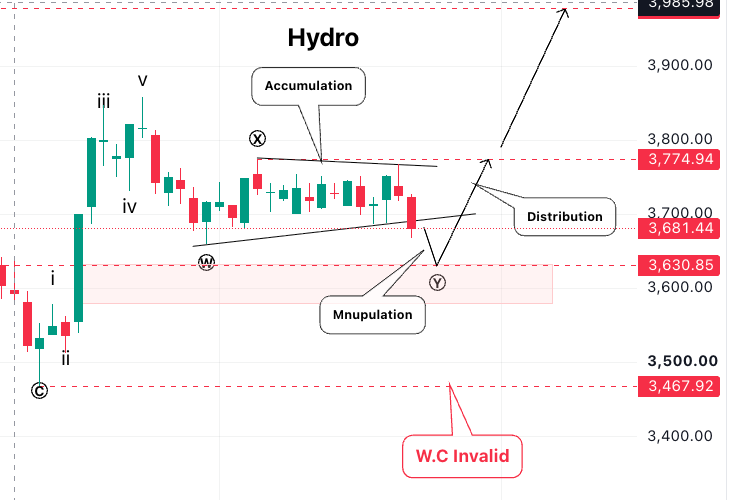
Hydro Index at a Critical Zone: Elliott Wave + ICT Analysis
Elliott Wave:The Hydro index appears to have completed a five-wave advance and is now forming a complex W-X-Y correction. The 3,580–3,630 area is being watched as a potential co...
 Market analysis
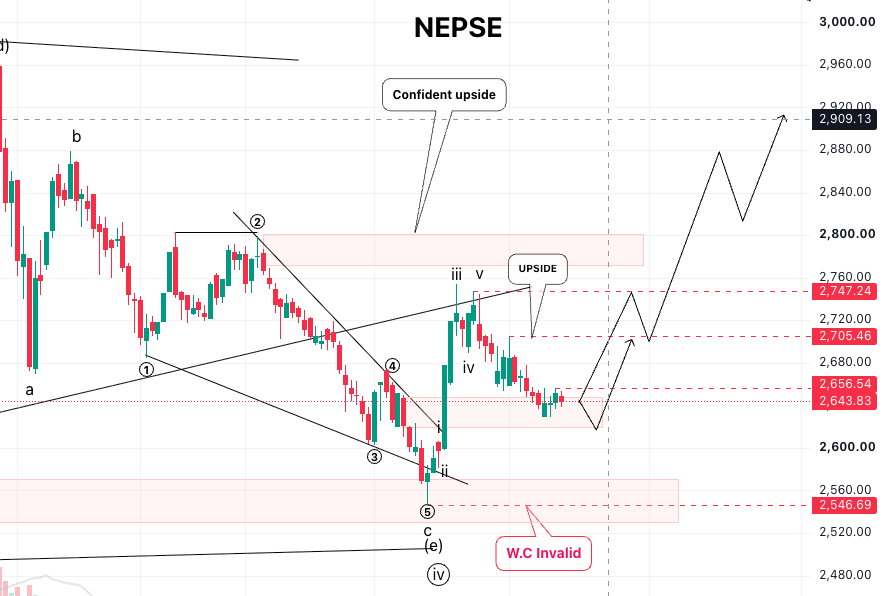
Nepse Technical Analysis
Daily Time FrameNEPSE has currently completed its 4th Minor Wave at 2,546, after which it started the 5th Minor Wave. The 5th wave has now completed its 1st Sub-Wave around 2,75...