GBPCAD Daily Chart
GBPCAD Daily Chart: The structure suggests a completed 5-wave move into the wedge top, with Wave C now invalid. Price has broken down from the terminal wedge and may retest the trendline intersection area (red circle) before initiating a larger impulsive decline toward 1.78521 and potentially the 1.74500 region.
Keep reading
 Daily recap
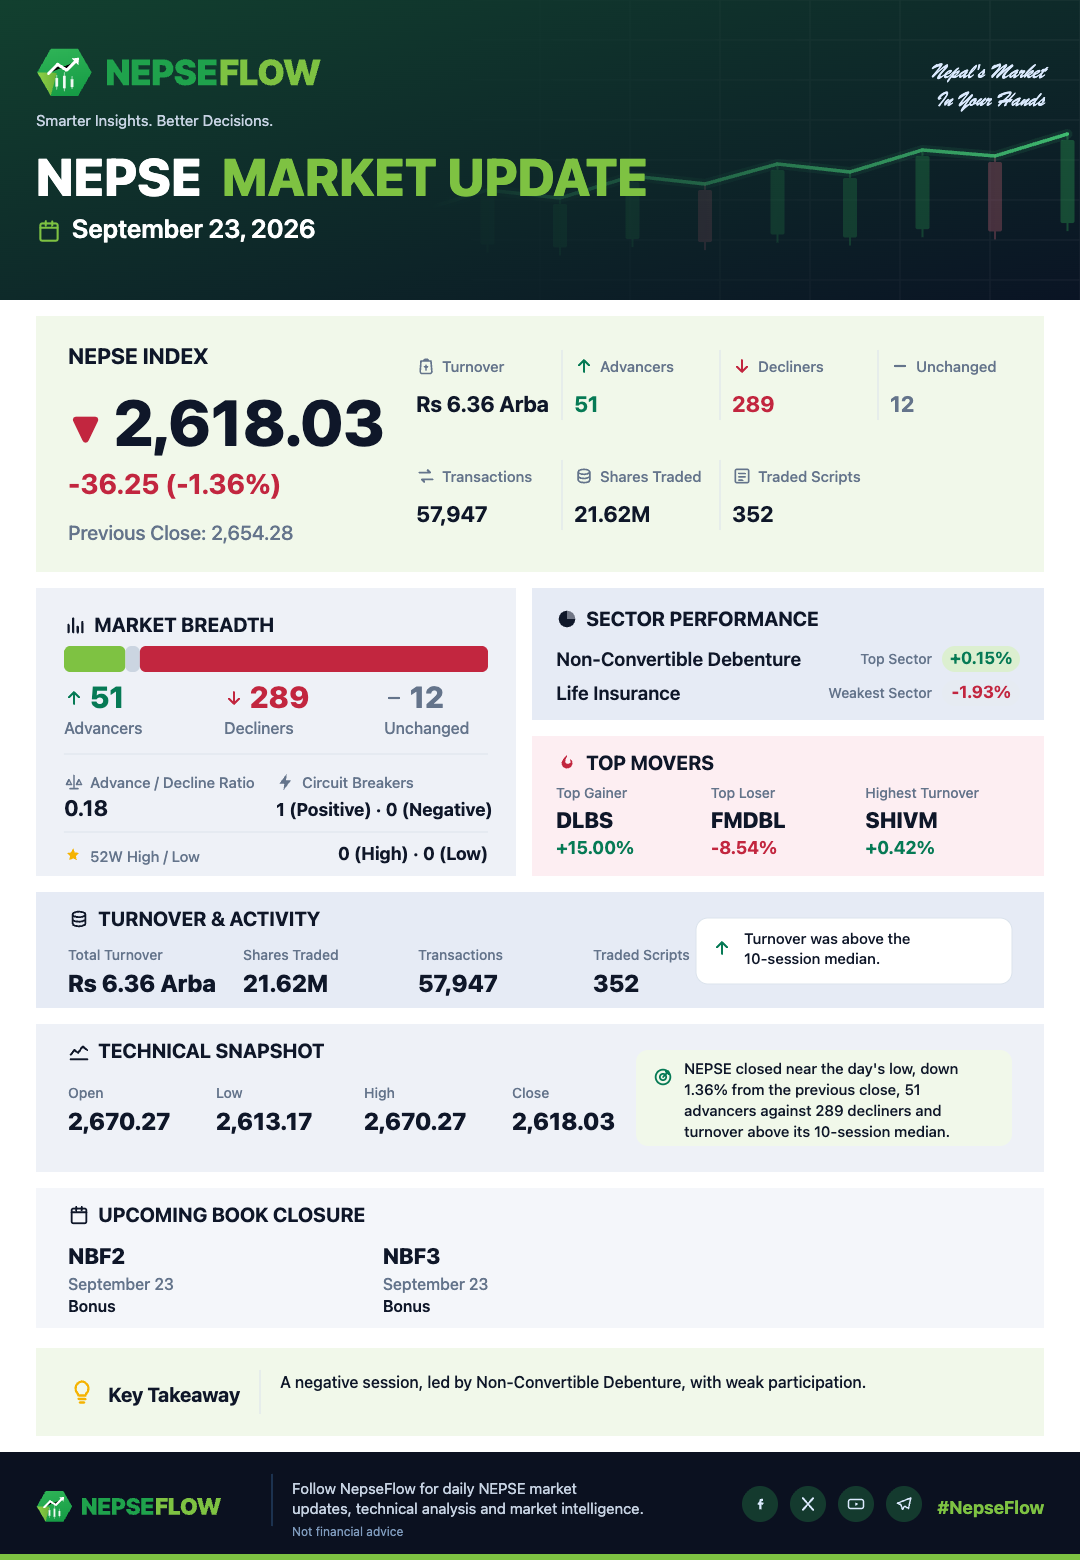
NEPSE closes -1.36 lower as breadth collapses to 51 advancers against 289 decliners
The market closed sharply lower, with the index at 2,618.03, a change of -36.25 or -1.36. Selling pressure was broad and one-sided: 51 stocks advanced while...
NEPSE closed higher at 2,654.28 on turnover that ran well above its recent median, though breadth narrowed sharply from the prior session.
The index finished the session at 2,654.28, a gain of +0.26%, with turnover rising to Rs 7.05 Arba — a reading that sits well above the trailing median and...
NEPSE closes higher at 2,647.22 as turnover rises and 228 stocks advance against 97 decliners.
The NEPSE index ended the session at 2,647.22, a gain of 22.85 points or +0.87% percent from the previous close of 2,624.37. The advance occurred on rising...