EURCAD 4H Elliott Wave Forecast
Following a robust bullish impulsive wave, potentially representing wave 3 of wave (1)/(A), the price has entered a sideways range that could result in the formation of a triangle pattern. If it cross the high of D wave , we anticipate another bullish wave, likely driving the price to the upside to establish a new high above the 1.6000 level, ideally targeting the 1.62962 area. A decisive break through of the triangle (as illustrated on the chart) will confirm the bullish scenario. After this key level is broken through, we can set the invalidation at the 1.555364 level.
Keep reading
 Daily recap
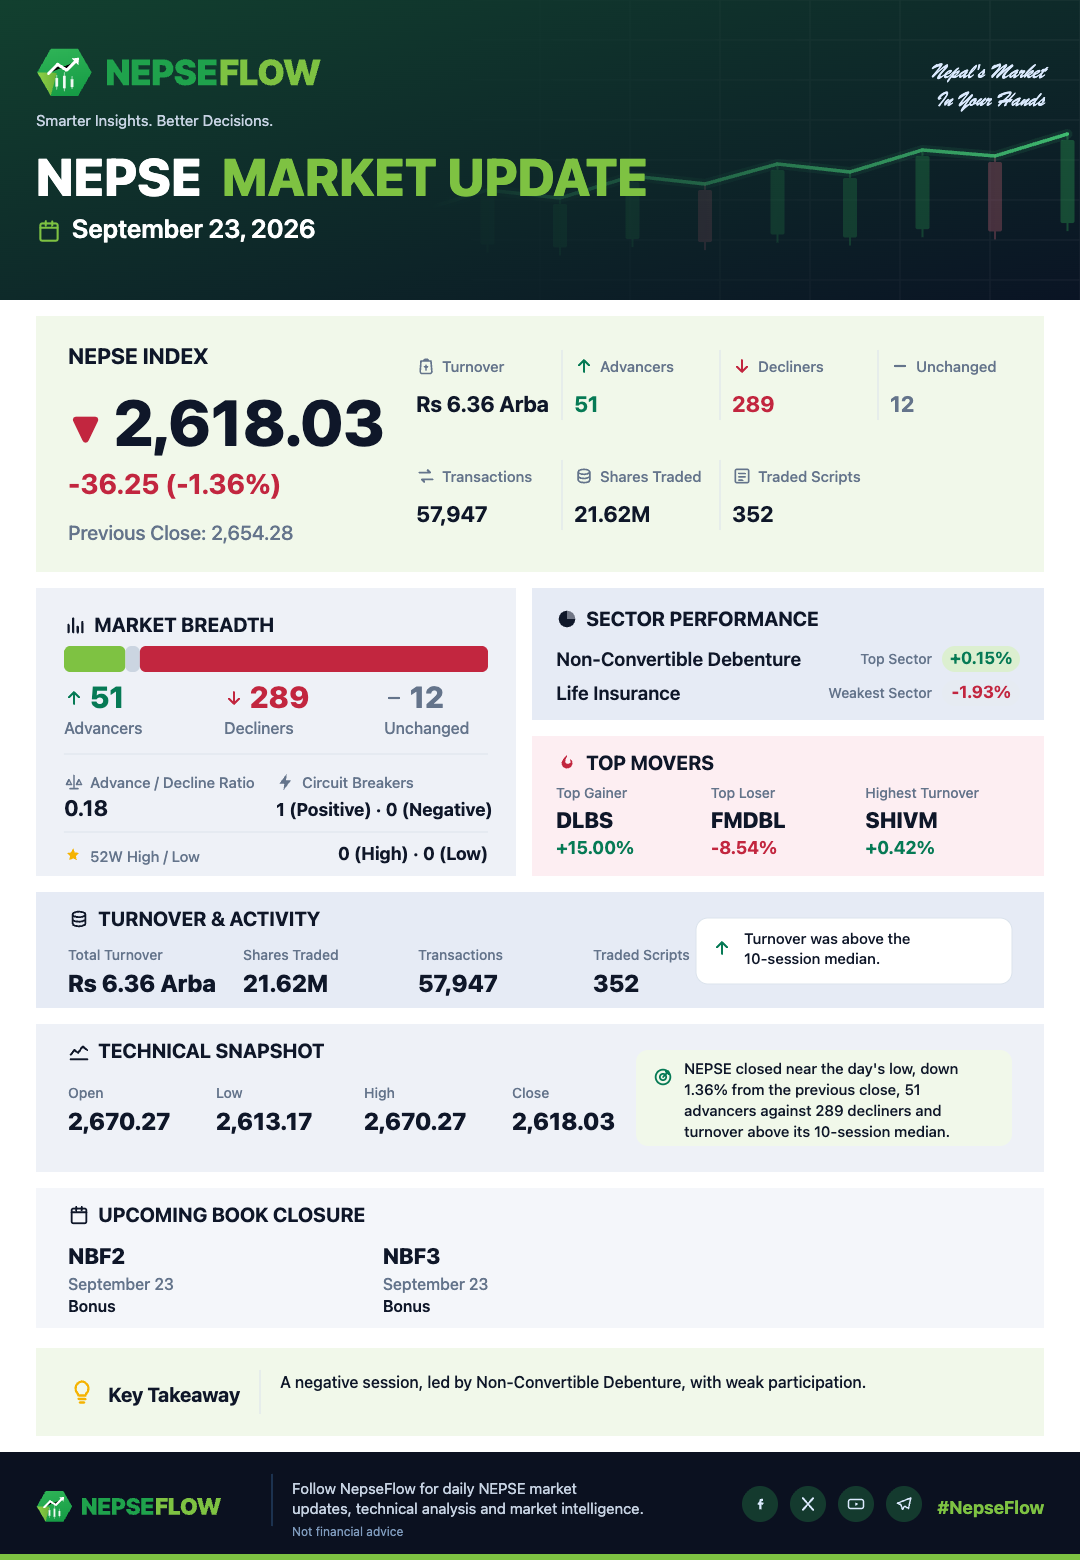
NEPSE closes -1.36 lower as breadth collapses to 51 advancers against 289 decliners
The market closed sharply lower, with the index at 2,618.03, a change of -36.25 or -1.36. Selling pressure was broad and one-sided: 51 stocks advanced while...
NEPSE closed higher at 2,654.28 on turnover that ran well above its recent median, though breadth narrowed sharply from the prior session.
The index finished the session at 2,654.28, a gain of +0.26%, with turnover rising to Rs 7.05 Arba — a reading that sits well above the trailing median and...
NEPSE closes higher at 2,647.22 as turnover rises and 228 stocks advance against 97 decliners.
The NEPSE index ended the session at 2,647.22, a gain of 22.85 points or +0.87% percent from the previous close of 2,624.37. The advance occurred on rising...